|
|
How to Read Surface Weather Maps
|
| Weather maps as they appear on TV, in a newspaper or here are called 'surface charts' or, more correctly, 'Mean Sea Level' (MSL) charts. They show what is happening at a set time where most of us need it - at the Earth's surface. They do NOT show what is happening at higher levels, where the wind flow may be doing something entirely different.
The Isobars
Isobars and the wind In the Northern Hemisphere,
If you LOOK into the wind, the LOW pressure is on your RIGHT. A law, formulated by the eponymous Dutch meteorologist in 1857, expressing the relationship of horizontal wind direction and pressure patterns; it states that if an observer faces the direction to which the wind is blowing, the lower pressure will be to the left in the Northern Hemisphere, and to the right in the Southern Hemisphere. Wind direction can thus be predicted, given the location of the lower pressure. It is a qualitative statement of the geostrophic wind equation. So from the isobars you can estimate the winds, but it is not quite as easy as Buys-Ballot's law. Here are five wind tips: |
|||||||||
 |
1. Winds blow almost directly (but not quite) along the isobars. This is just another way of giving Buys-Ballot's law. |
||||||||
 |
2. The closer the isobars, the stronger the winds. This varies with latitude ... on a weather map with isobars 4 hectoPascals apart, a spacing of about two degrees latitude (with straight isobars) means fresh winds about Auckland but a gale over Fiji. |
||||||||
 |
3. Surface wind 'leaks' across the isobars towards lowpressure, By about 15 to 20 degrees over the open sea, but by as much as 30 to 90 degrees over and around land. This time, the red arrows show the wind directions as they are more likely to be - gently flowing across the isobars towards lower pressure. |
||||||||
 |
4. Because of the 'spin-out' effect when turning corners, the wind speed can be: |
||||||||
 |
5. Isobars are only smoothed-out approximations And only tell about the general wind flow, not the details. Wind flow over land is not simple ... it is like water flowing over a rocky brook, eddying around corners and rushing between boulders. Actual wind accelerates down valleys, bends around headlands, bumps about abutments, is contorted by the coastline, dips and dives over hills and dales, eddies behind mountains, and gallops through gaps. There is a natural reluctance for surface wind to move over land in the cool of the night or near dawn, and it may be drawn onshore during a hot day (sea breeze), or offshore at night (land breeze). Mountain air cooled at night sinks down valleys and flowsout to sea (katabatic wind). These effects do not show up in the isobars on the weather map but can halve or double the local wind speed, and distort its direction (always towards low pressure). |
||||||||
 |
Effects of Terrain One terrain effect does show up on the weather map: chains of mountains distort isobars crossing them. In the example to the upper right, the Southern Alps buckle the isobars coming in from the Tasman Sea, with a build-up of pressure on the windward side and a counter-balancing drop of pressure down-wind from the mountains. Because of this distortion, avoid trying to use isobars over mountains to work out wind direction. Also, in general, avoid using isobars to work out windflow over high ground. Also shown in the example to the upper right, in red, are observations of the surface wind at MetService stations for the same time as the isobars. The "long" part of the wind arrow shows the direction. As can be seen, some winds line up nicely with the isobars and others are almost at right angles to them. |
||||||||
 |
The Highs When isobars enclose an area of high pressure this is called a High or anticyclone and its centre is labelled on a weather map by an 'H'. The term 'anticyclone' is a bit of meteorological jargon. The central pressure of a weak High is about 1015hPa,while a strong or intense High has a central pressureabove about 1030hPa. An intensifying High has a rising central pressure, while a weakening High has a falling central pressure. Near a High's centre are light winds and sometimes areas of low cloud called anticyclonic gloom. Round the edge of a High, the winds are sometimes strong. Intense Highs tend to squeeze the isobars together creating areas of strong winds. Winter Highs often bring frost; summer Highs may bring thunderstorms and hail. The bigger Highs are, the slower they tend to move, sometimes 'blocking' the fronts that are trying to follow them. |
||||||||
 |
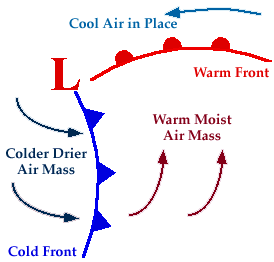
The Lows Isobars make shapes and patterns. When they enclose an area of low pressure this is called a 'Low' or 'depression' and its centre is labelled on a weather map with an 'L'. The term depression is a bit of meteorological jargon. A low pressure system is like a giant funnel of wind spiralling inwards and upwards forcing warmish air in the centre to rise. As air rises it cools and clouds form. The central pressure of a shallow Low is above 1000 hPa, of a moderate Low 980-1000 hPa, and of a deep or intense Low below 980hPa. If there are two or more centres the Low is said to be complex. If the central pressure is rising the Low is said to be filling or weakening. If the central pressure is falling the Low is said to be intensifying or deepening. The satellite picture to the upper right (from the satellite GMS-5, courtesy of the Japan Meteorological Agency) shows cloud patterns fairly typical of those associated with Highs and Lows |
||||||||
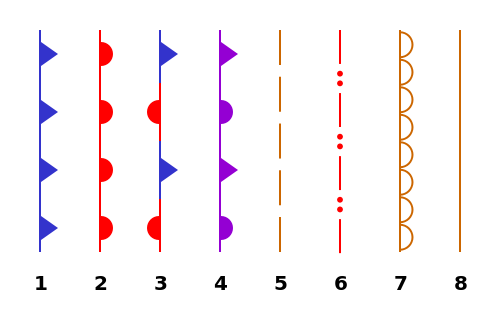
| Fronts, Troughs and Convergence Zones A front marks the boundary between two air-masses, and appears on the weather map as a line with triangles or semicircles attached. Weather map symbols:
|
|||||||||
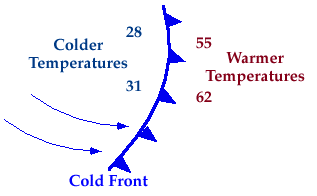 |
Cold Front A cold front is located at the leading edge of the temperature drop off, which in an isotherm analysis shows up as the leading edge of the isotherm gradient, and it normally lies within a sharp surface trough. Cold fronts can move up to twice as quickly as, and produce sharper changes in weather than, warm fronts, since cold air is denser than warm air and rapidly replaces the warm air preceding the boundary. On weather maps, the surface position of the cold front is marked with the symbol of a blue line of triangle-shaped pips pointing in the direction of travel, and it is placed at the leading edge of the cooler air mass. Cold fronts come in association with a low pressure area. The concept of colder, dense air "wedging" under the less dense warmer air is often used to depict how air is lifted along a frontal boundary. The cold air wedging underneath warmer air creates the strongest winds just above the ground surface, a phonemena often associated with property-damaging wind gusts. This lift would then form a narrow line of showers and thunderstorms if enough moisture were present. |
||||||||
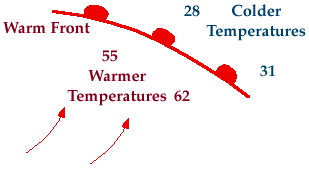 |
Warm Front Warm fronts are at the leading edge of a homogeneous warm air mass, which is located on the equator ward edge of the gradient in isotherms, and lie within broader troughs of low pressure than cold fronts. A warm front moves more slowly than the cold front which usually follows because cold air is denser and harder to remove from the Earth's surface. This also forces temperature differences across warm fronts to be broader in scale. Clouds ahead of the warm front are mostly strati form, and rainfall gradually increases as the front approaches. Fog can also occur preceding a warm frontal passage. Clearing and warming is usually rapid after frontal passage. If the warm air mass is unstable, thunderstorms may be embedded among the strati form clouds ahead of the front, and after frontal passage thundershowers may continue. On weather maps, the surface location of a warm front is marked with a red line of semicircles pointing in the direction of travel. |
||||||||
 |
Occluded Front An occluded front is formed when a cold front overtakes a warm front. The cold and warm fronts curve naturally poleward into the point of occlusion, which is also known as the triple point. It lies within a sharp trough, but the air mass behind the boundary can be either warm or cold. In a cold occlusion, the air mass overtaking the warm front is cooler than the cool air ahead of the warm front and plows under both air masses. In a warm occlusion, the air mass overtaking the warm front is warmer than the cold air ahead of the warm front and rides over the colder air mass while lifting the warm air. A wide variety of weather can be found along an occluded front, with thunderstorms possible, but usually their passage is associated with a drying of the air mass. Occluded fronts are indicated on a weather map by a purple line with alternating half-circles and triangles pointing in direction of travel. Occluded fronts usually form around mature low-pressure areas. |
||||||||
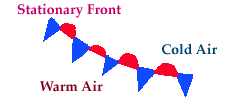 |
Stationary Font A stationary front is a non-moving (or stalled) boundary between two air masses, neither of which is strong enough to replace the other. They tend to remain essentially in the same area for extended periods of time, usually moving in waves. There is normally a broad temperature gradient behind the boundary with more widely spaced isotherm packing. A wide variety of weather can be found along a stationary front, but usually clouds and prolonged precipitation are found there. Stationary fronts either dissipate after several days or devolve into shear lines, but they can transform into a cold or warm front if conditions aloft change. Stationary fronts are marked on weather maps with alternating red half-circles and blue spikes pointing in opposite directions, indicating no significant movement. When stationary fronts become smaller in scale, degenerating to a narrow zone where wind direction changes significantly over a relatively short distance, they become known as shearlines. A shearline is depicted as a line of red dots and dashes. |
||||||||
 |
When isobars make a sharp bend around a Low, this bend area is calleda trough of low pressure or simply a trough. Troughs are also often shaped like tongues and usually contain weather similar to lows and fronts. | ||||||||
 |
Horizontal convergence Horizontal convergence is the coming together of two flows of air. When these two flows of air are from different air masses and significant cloud and weather result, the resulting line of convergence is commonly drawn as a front. However, when these two flows of air are in the same air mass and significant cloud and weather result, the weather feature is drawn as a convergence line. Convergence lines are only drawn in the tropics. |
||||||||
 |
Ridges and Cols When isobars turn a sharp corner around a High they form what is called a ridge of high pressure, which is often shaped like a tongue extending from the High centre. The weather in a ridge is an extension of the weather in the High.
A col is the name for the area of light variable winds that lies between two neighbouring pressure systems. Often this area contains either fog or thunderstorms
|
||||||||
Cell 01 |
Cell 02 |
||||
Cell 01 |
Cell 02 |
Cell 03 |
My QTH
(Home Location)
Grid Square: FM18PT83OV
CQ Zone 5
I.T.U Zone 8
Latitude: 38.90970253171965
Longitude: -76.51880979537964
Latitude: N38°48.47'
Longitude: W76°40.70'
Latitude: 38.910°
Longitude: -76.519°
Footer last updated:
October 15, 2023 9:50 -->